about project
About Stratejos Website
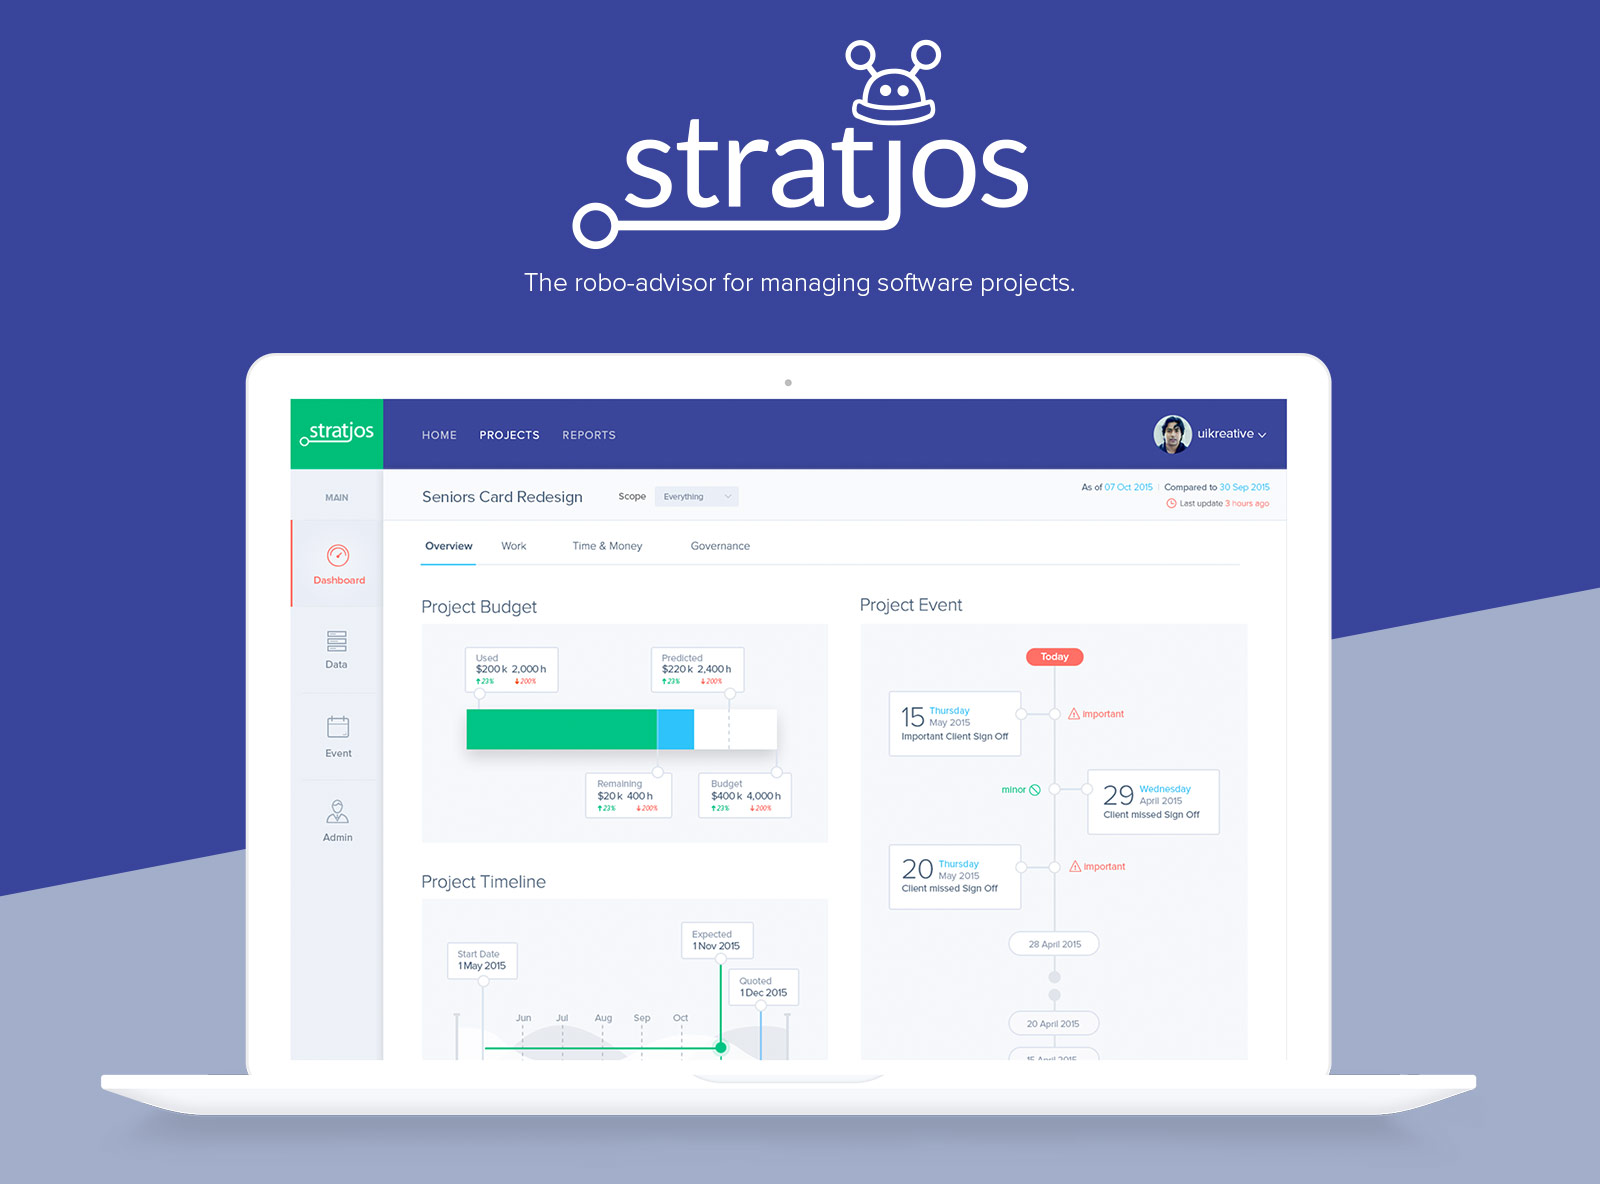
Stratejos is a software-as-a-service product that provides analytics for software project managers running software projects. Stratejos is a greek term and the origin of the word Strategy. Stratejos connects to your tools – like JIRA – and takes care of the admin, reporting and follow-ups you never have time for. Then stratejos gives you insights plus it coaches you and your team on better practices. Free yourself up and improve performance.
- My role
- Design Direction
- User Research
- UX/UI Design
- Illustrations & Animations
- Service
- Website Design
- Backend Admin Pages
- Product Management

My Role
My role was to create high quality UI/UX design for Admin and Member pages. I tried perfect balance between professional and warm/friendly in brand tone. I used brand imagery with idea as intelligence, artificial intelligence, machine learning, robots, project management, software projects. As client was big fan of material design so I create UI/UX with material design guidelines. I used circuit board lines in all graphs and animations as its very important for client.

Logo Guideline
Client was also looking for very very simple logo for Stratgos and want to use the circuit board imagery in their logo. So I design logo with that reflects: artificial intelligence, robotics, machinery without distract the user. I designed with just just an S icon for Mobile version and logo S icon with the word Strategos or Strategos for Desktop and other long version.

Dashboard Design
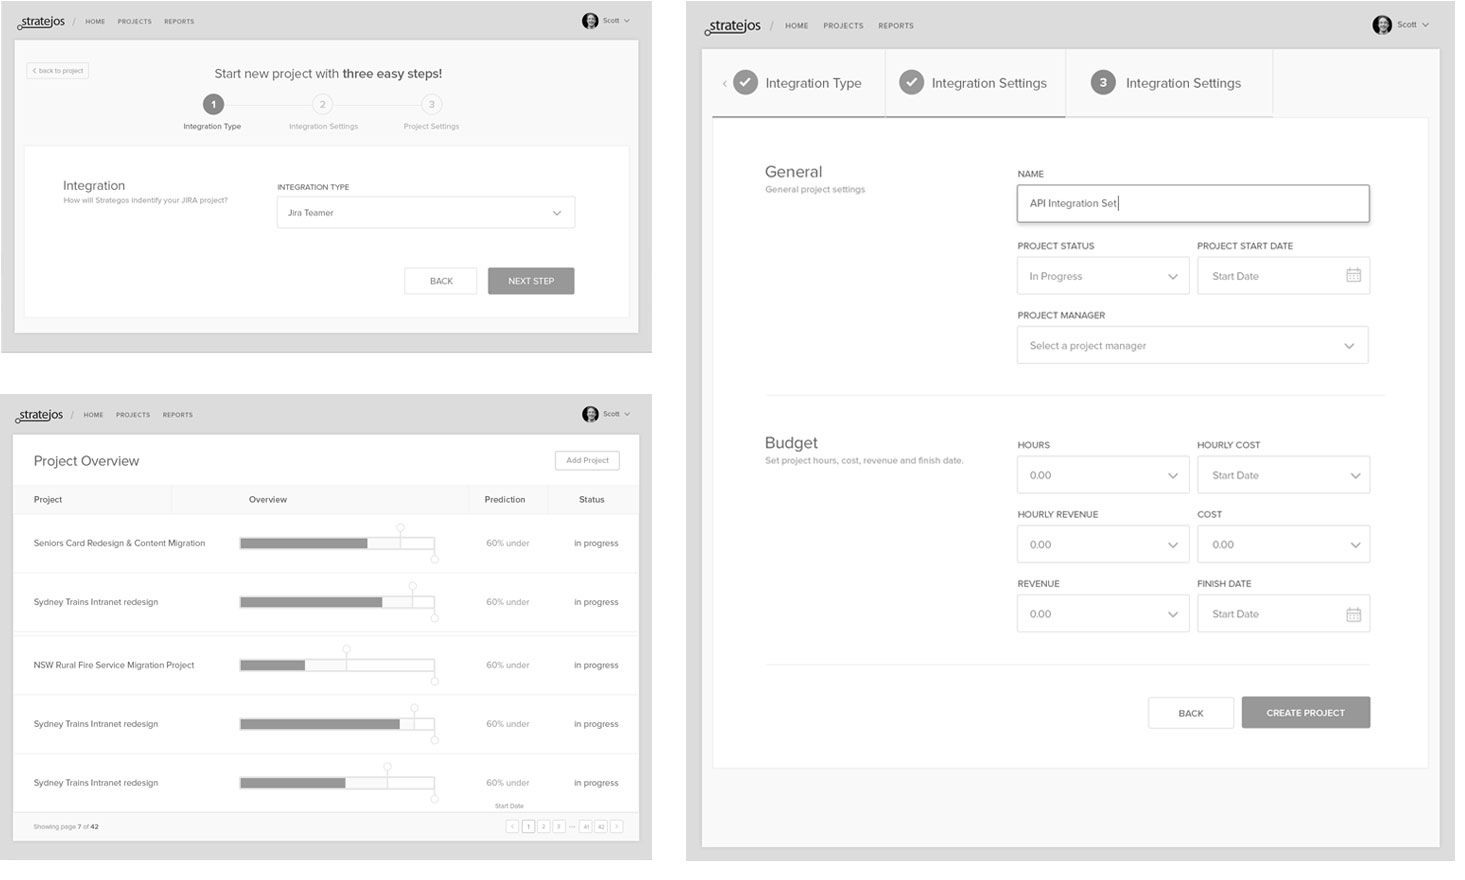
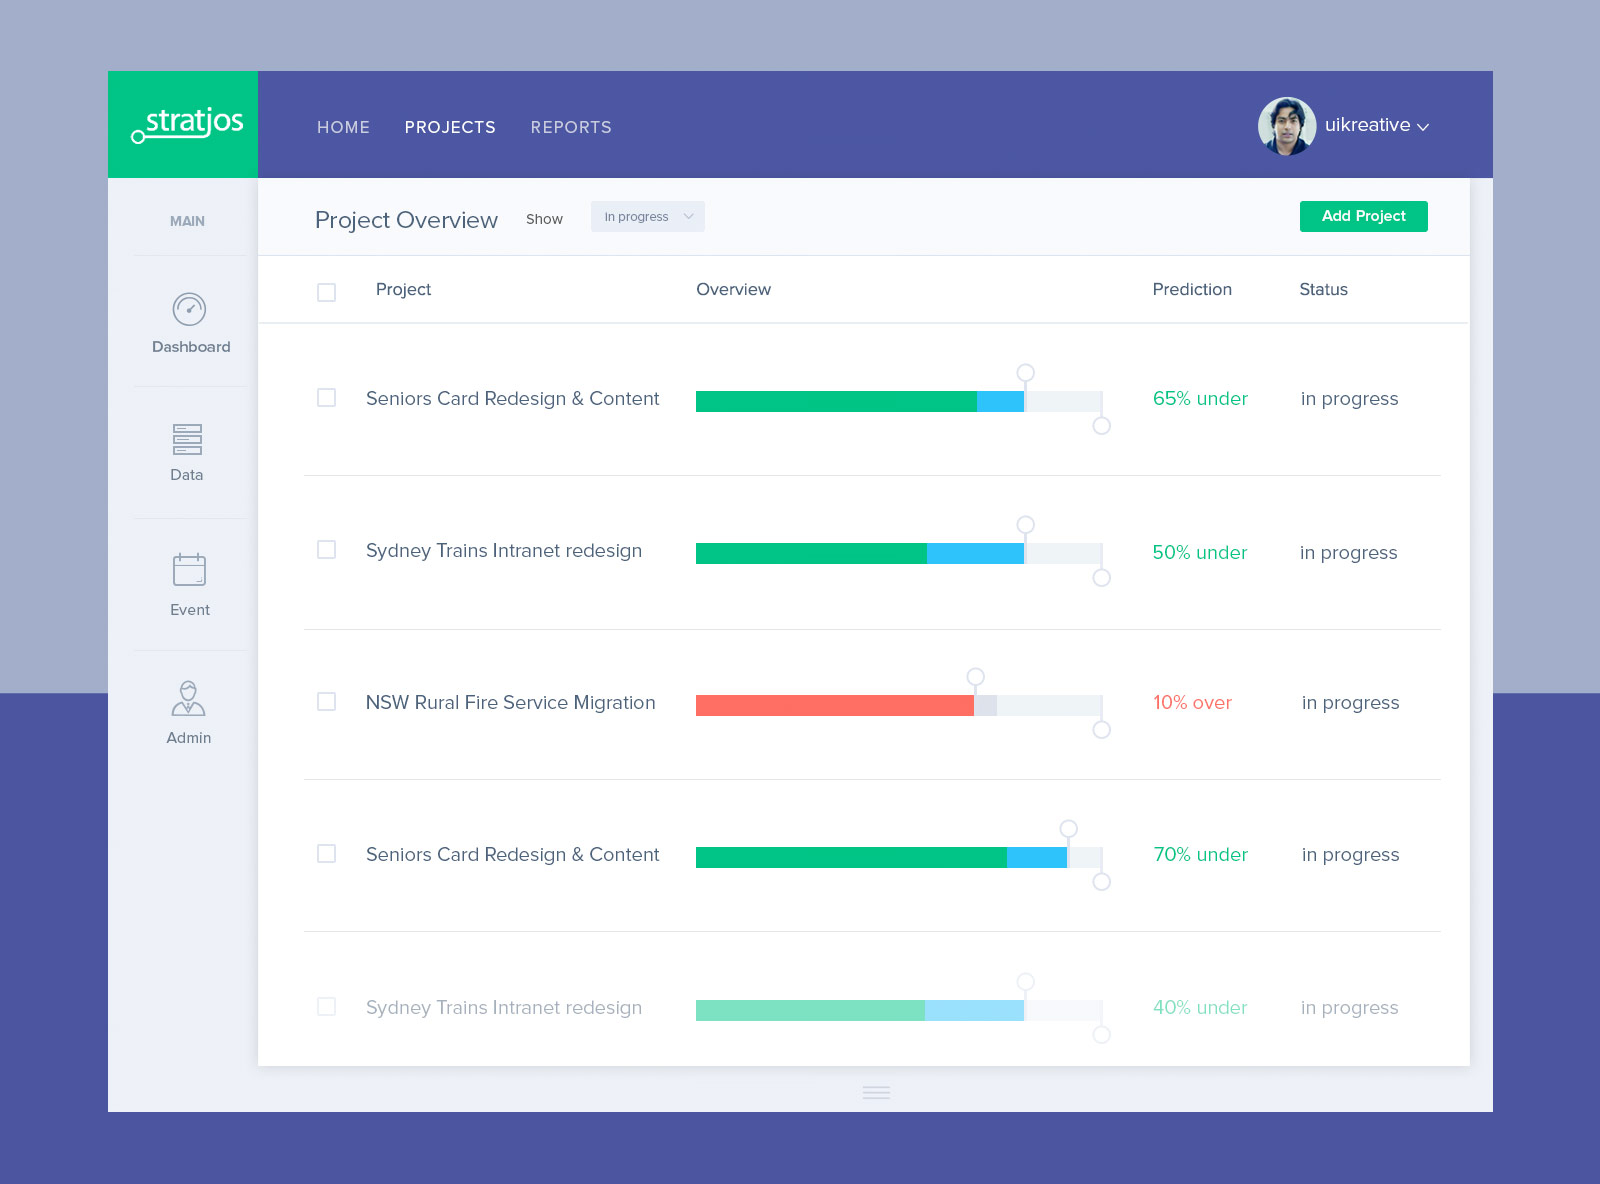
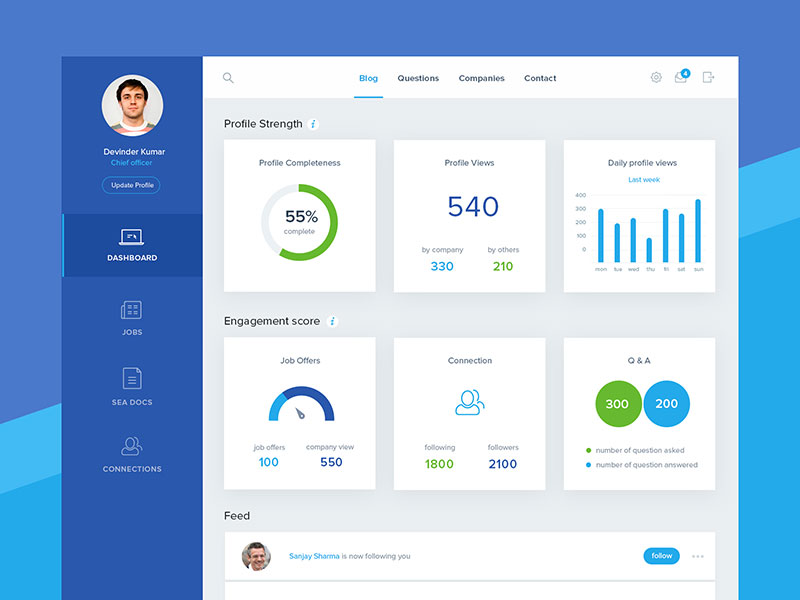
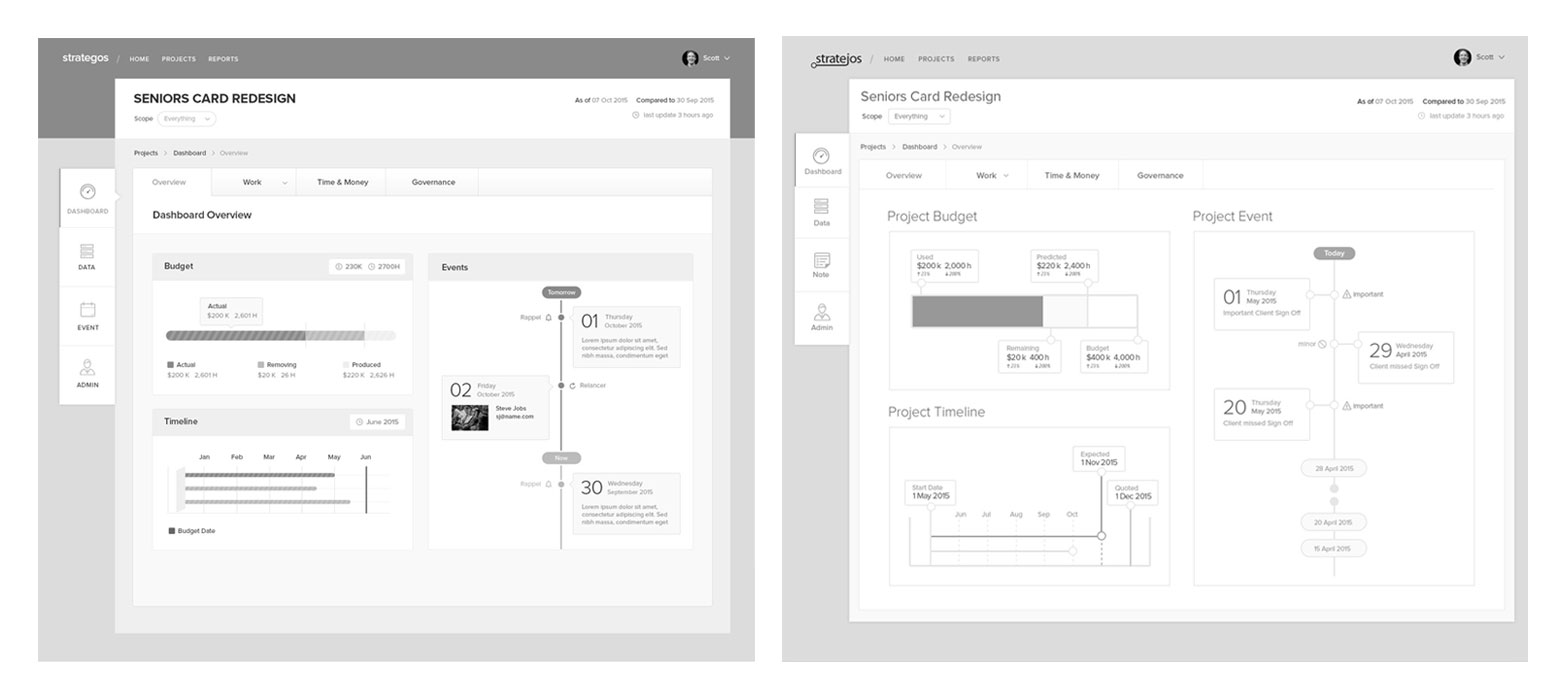
The Purpose of the overview dashboard is to give project managers a quick glipse into budget, event, timeline, current risks on a project. Save time building the same old status report, My job is to provide interactive dashboards, reports and metrics that gives user measurable views of performance.
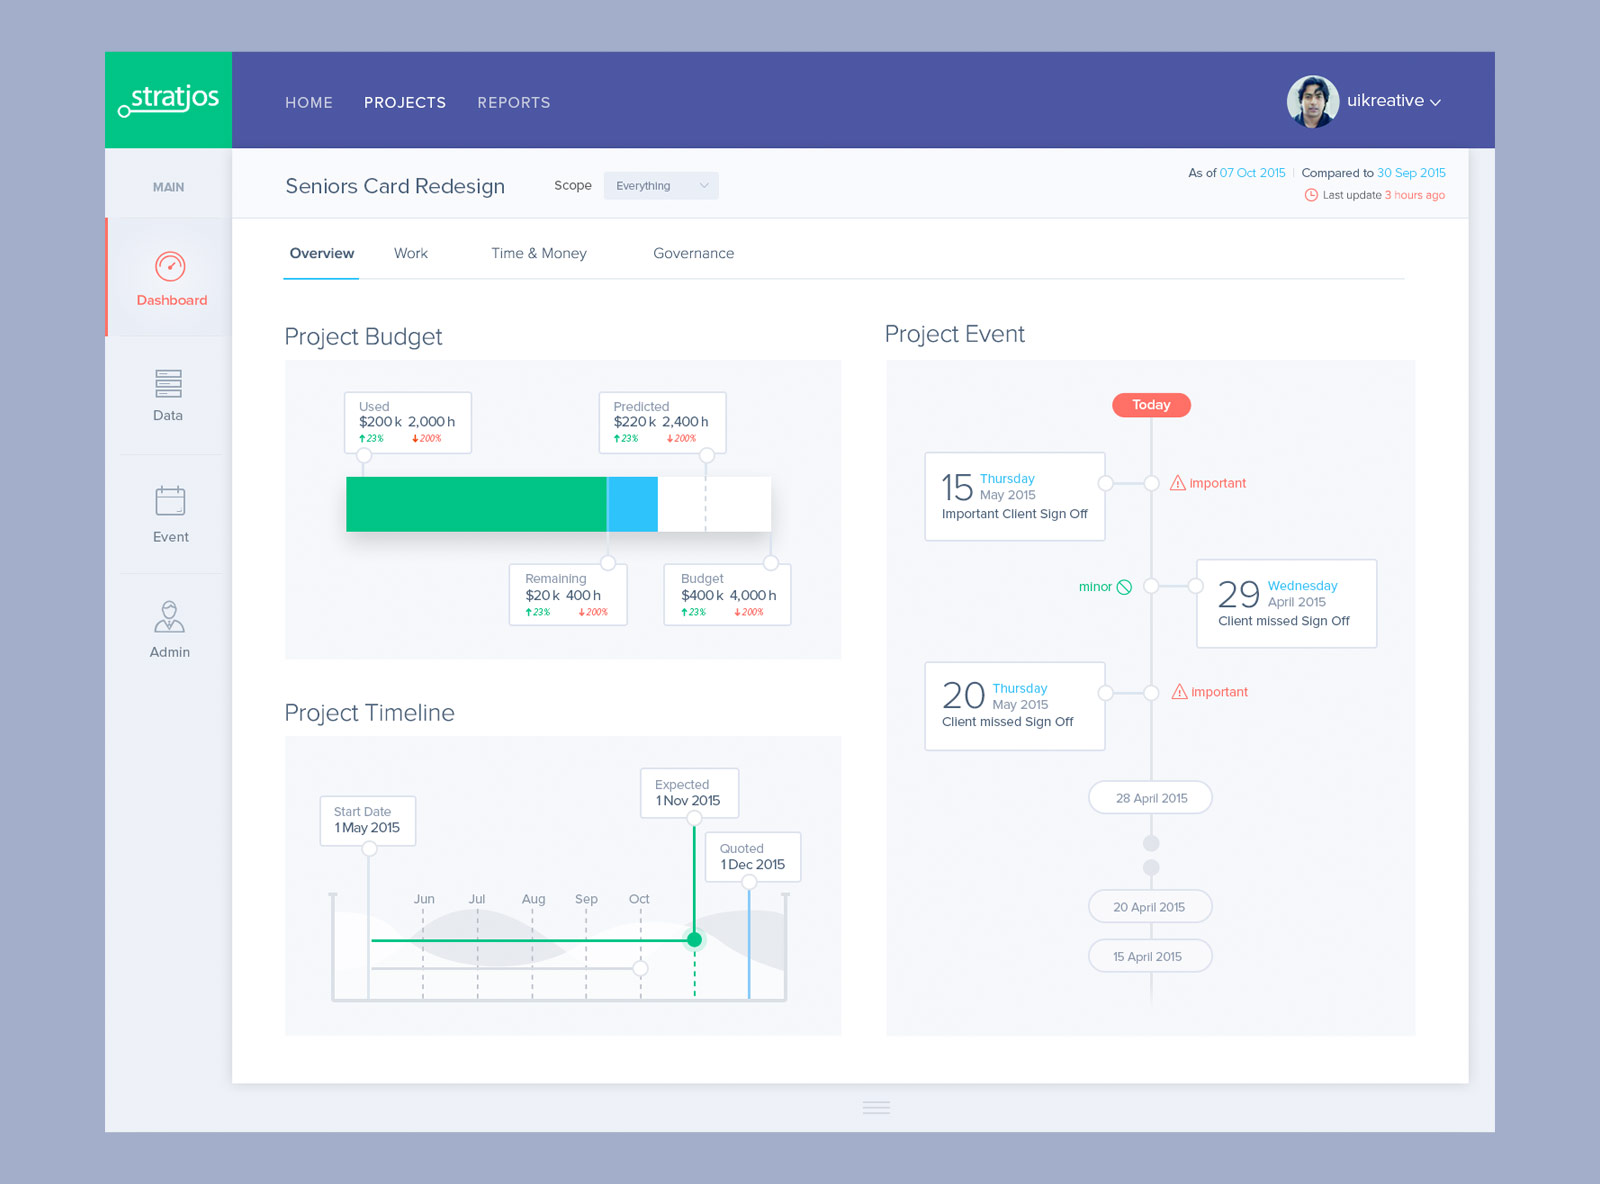
Running over time or over budget
Save time building the same old status report, let stratejos provide you interactive dashboards and reports in real-time. Get notifed of risks before they happen then visualise the impact they may have. Use advanced analytics to really understand where things are and where they are going.
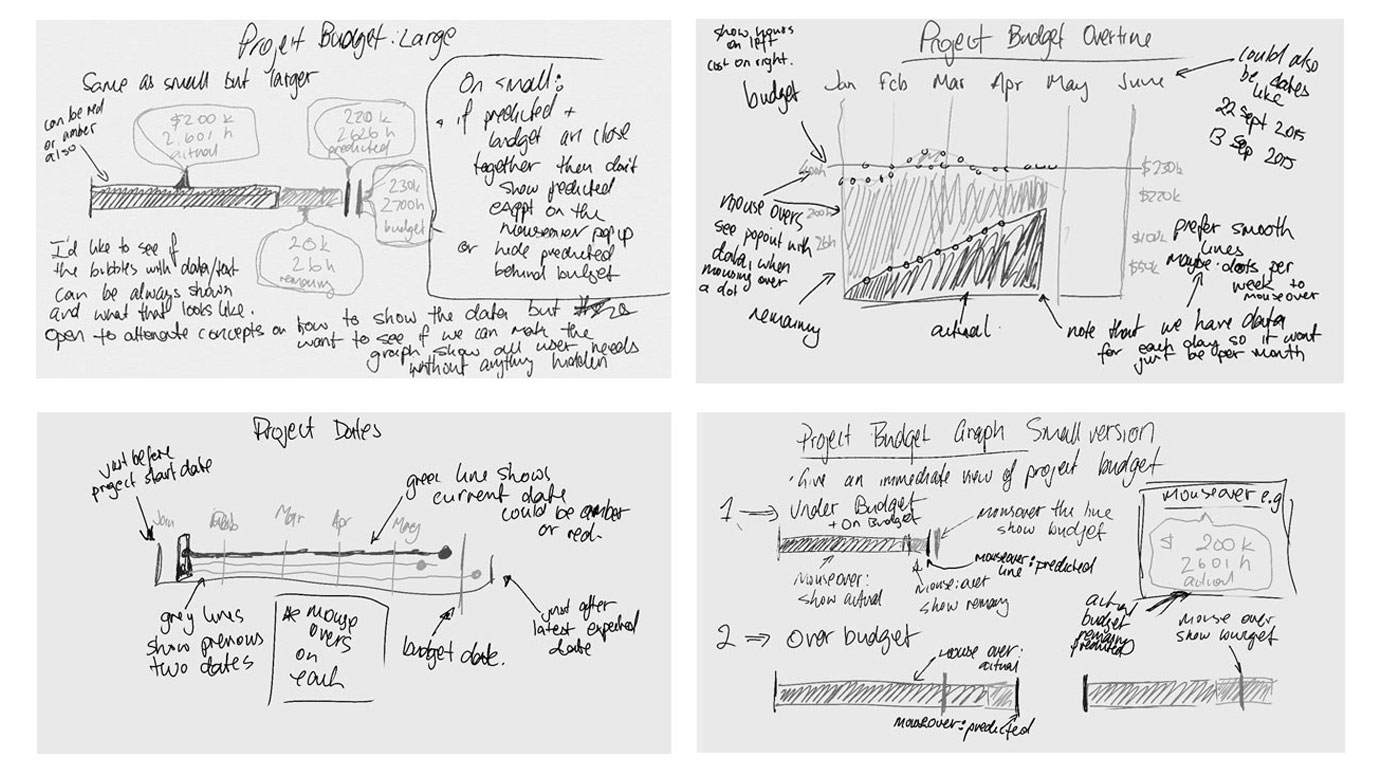
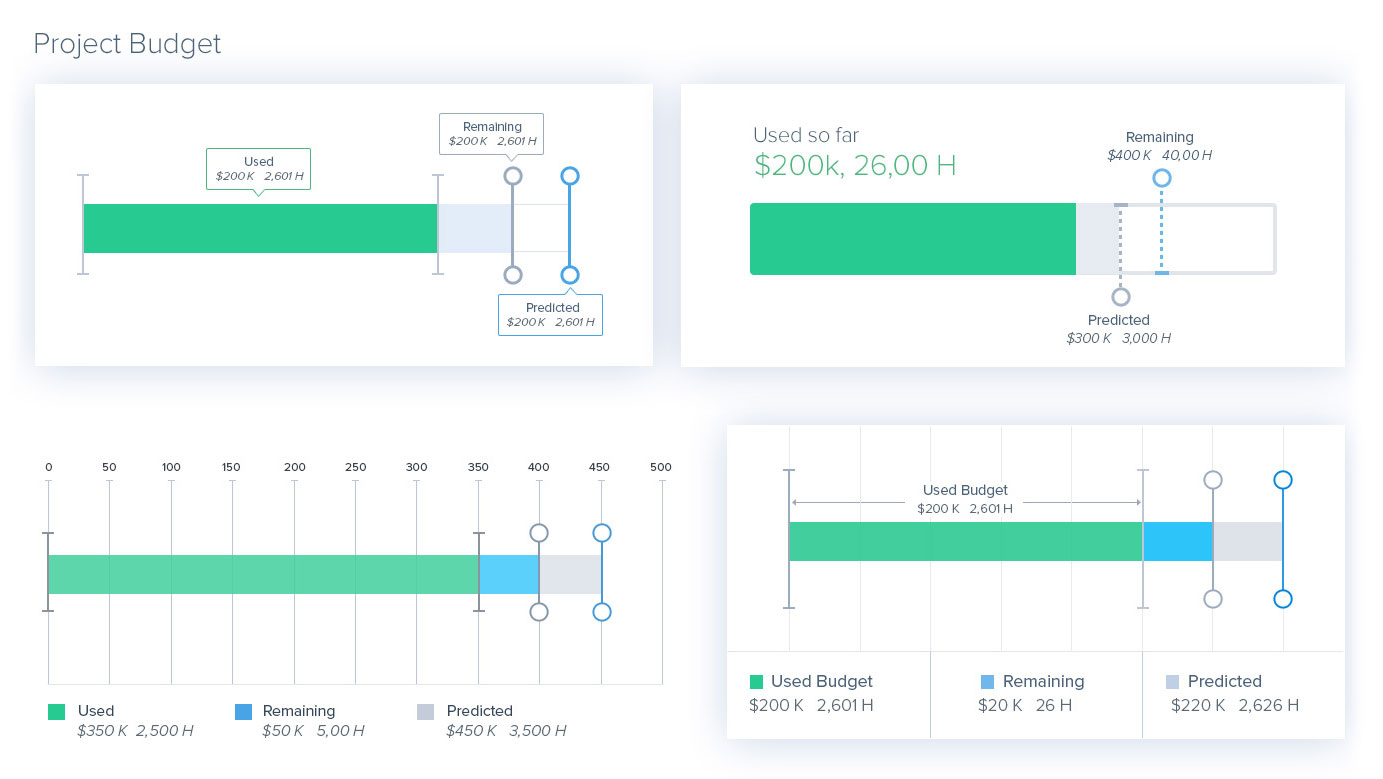

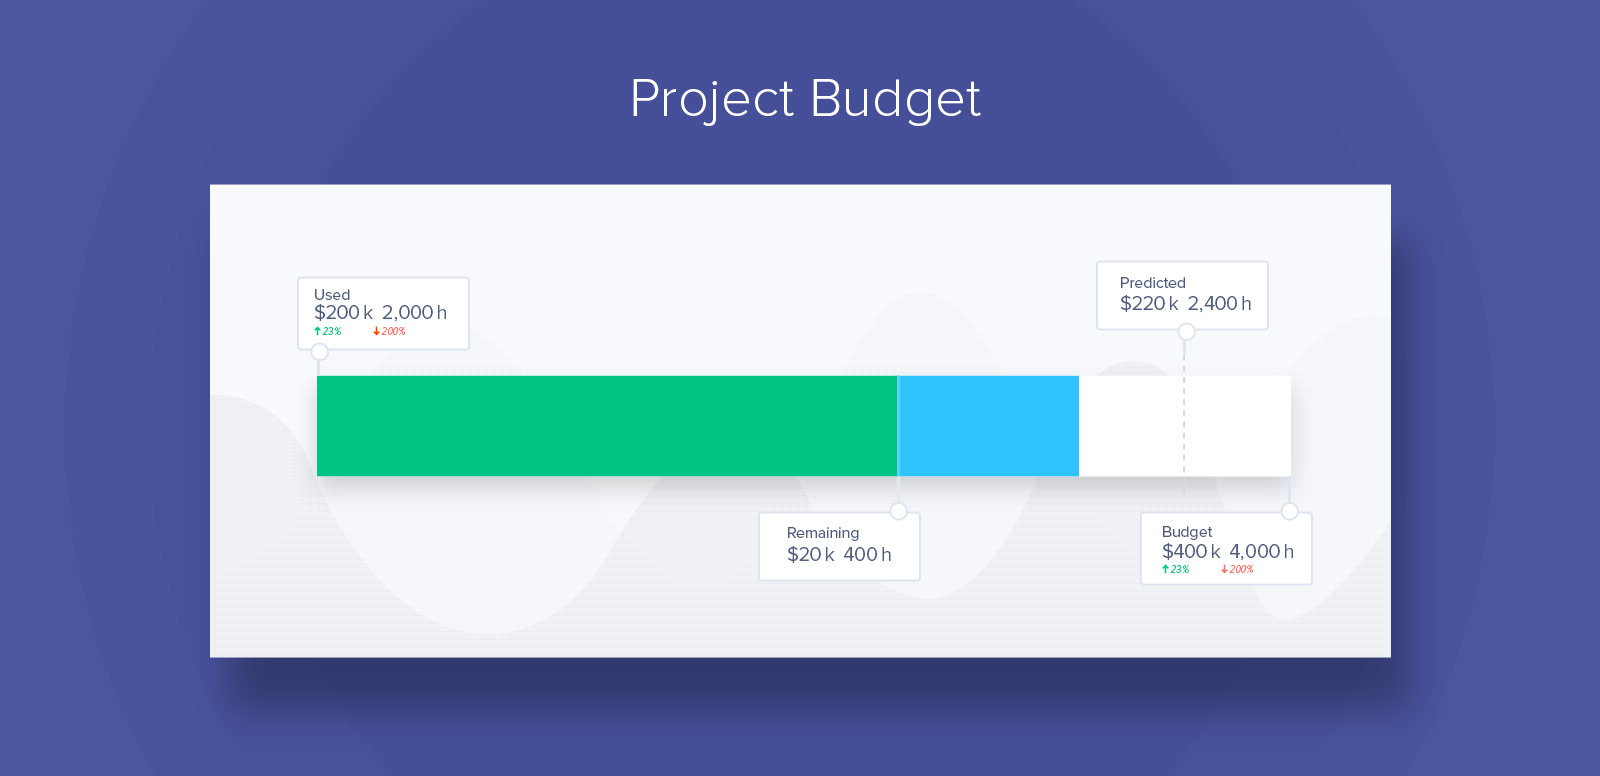
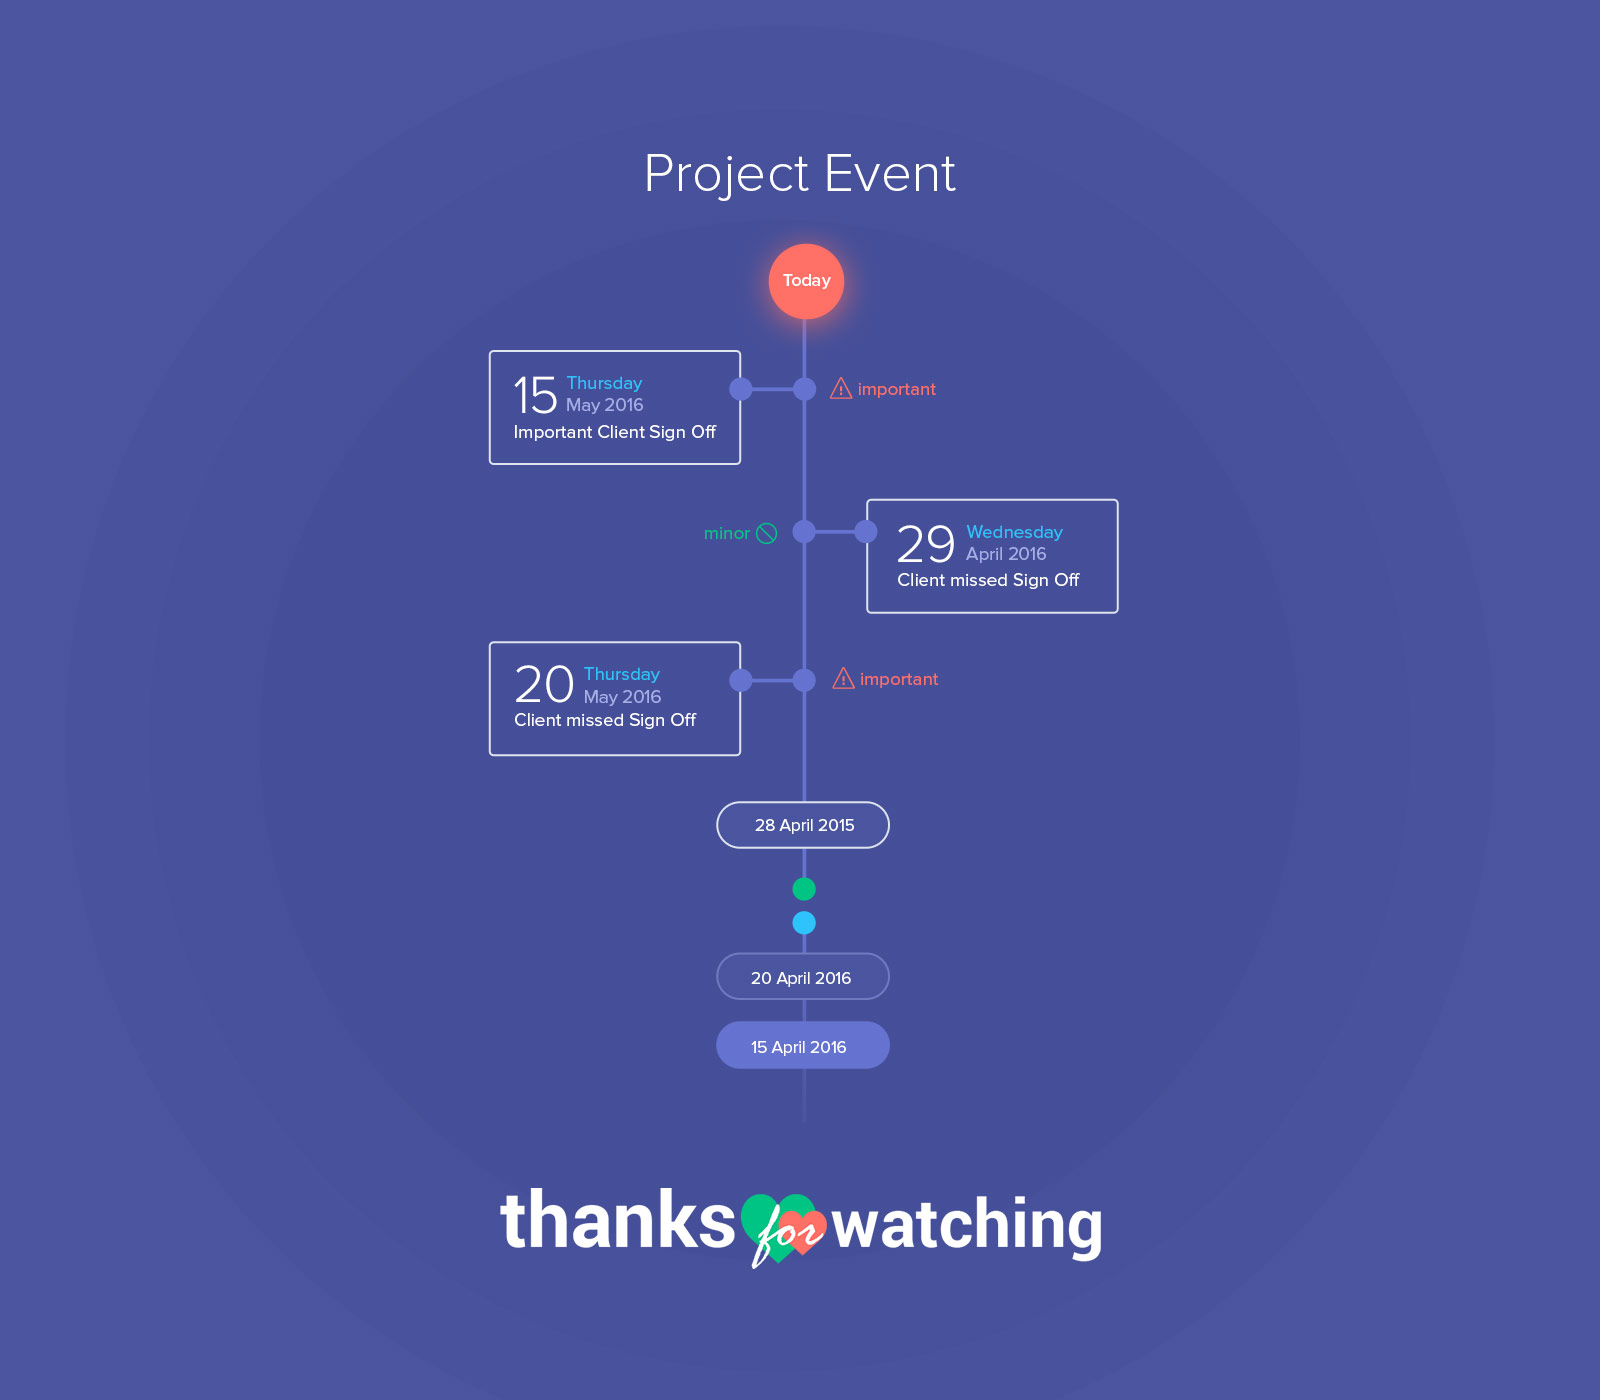
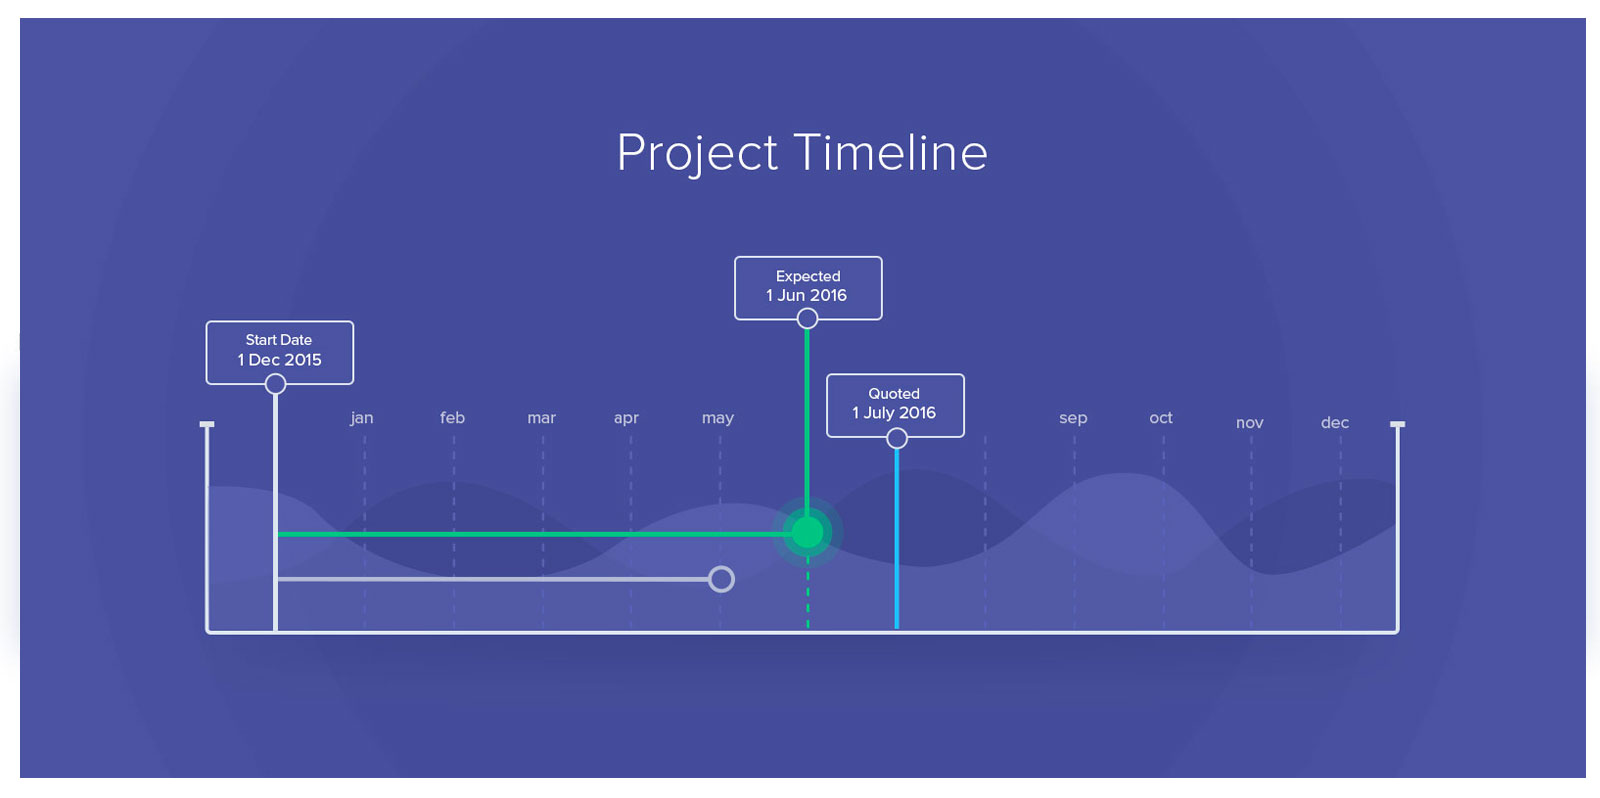
Project Timeline
Save time building the same old status report, let stratejos provide you interactive dashboards and reports in real-time. Get notifed of risks before they happen then visualise the impact they may have. Use advanced analytics to really understand where things are and where they are going.

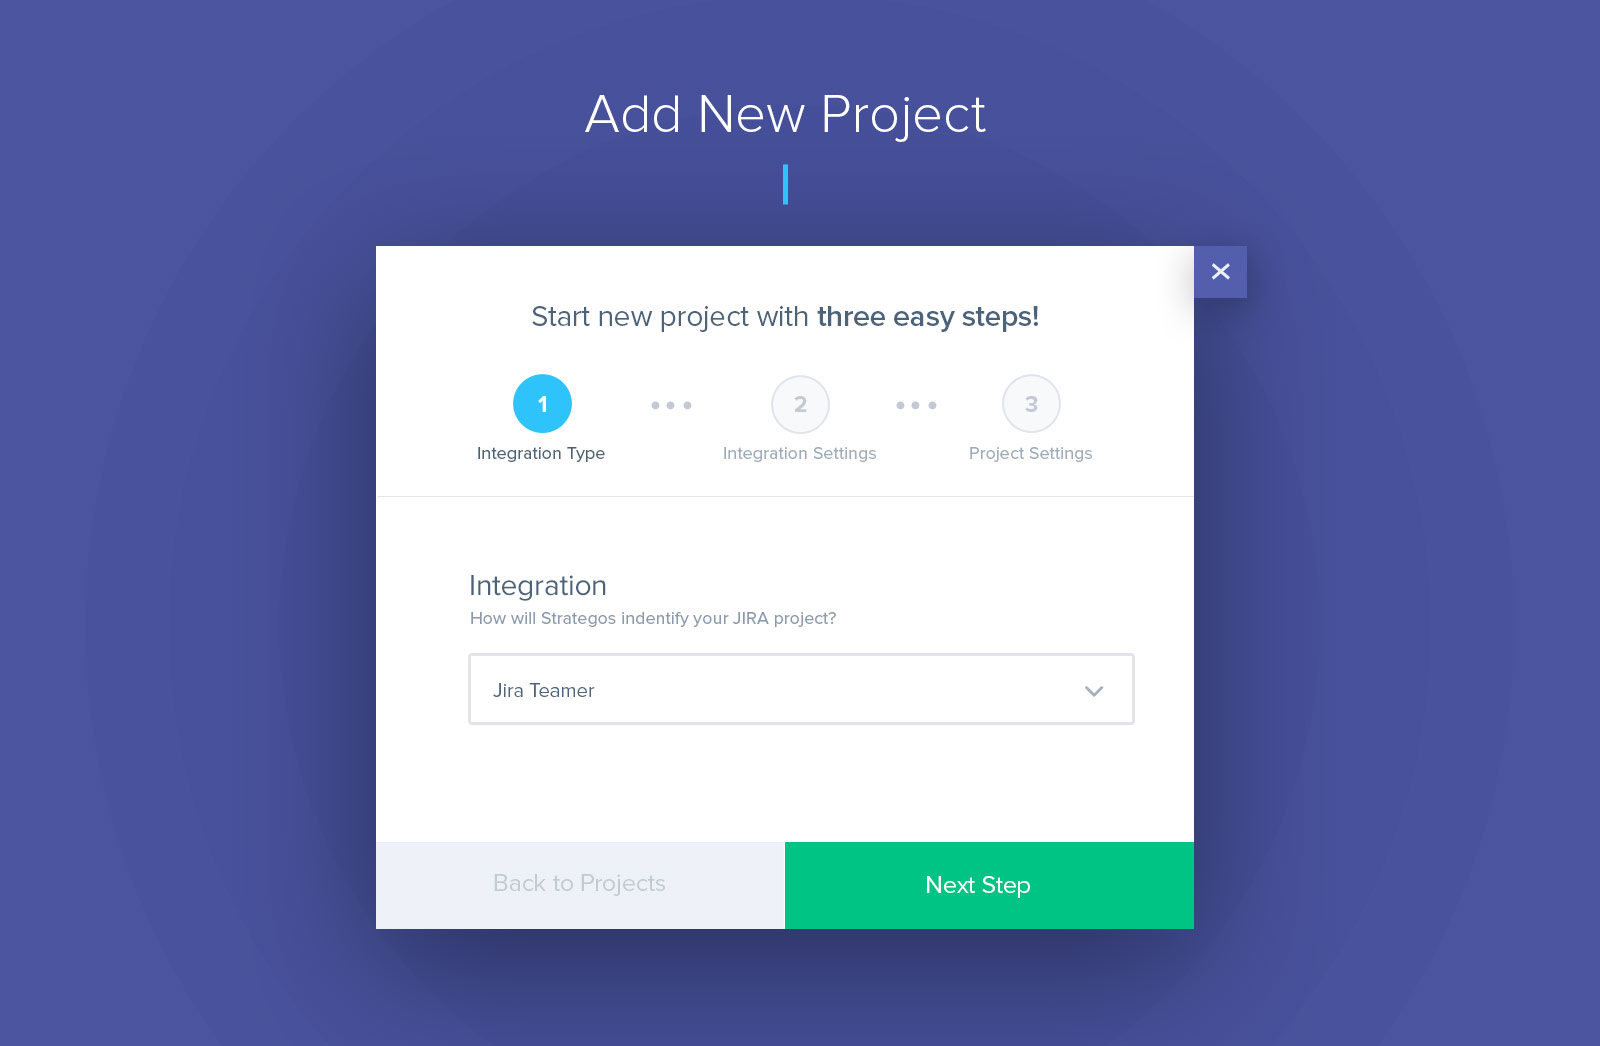
Add New Projects
Learn more about your teams and individuals with dashboards, reports and metrics that give you measurable views of performance. Find out if you have too much, too little or if priorities aren’t being followed. Get sprint analytics to monitor progress, predict what will happen and debug what went wrong.
